Math Parse Tree
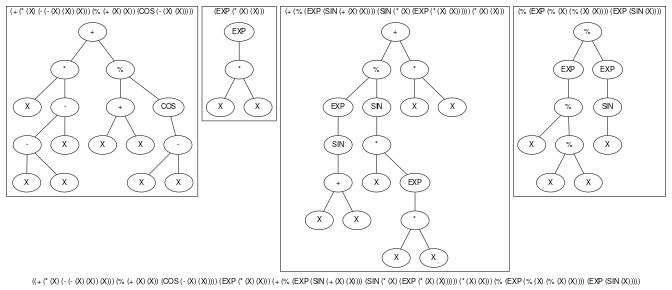
"This is an example from a real-world application, where we were using Genetic Programming to do simple symbolic regression. We needed a good way to visualize the trees that were being created, and it didn't take long to code up some lisp to create a dot file that visualized multiple individuals. The next step was to provide color-coding of key nodes so that we could illustrate crossover and mutation of individuals before-and-after-style. This is a sample dot file from some early debugging." Contributed by Wayne Folta.

[Input .gv File] [SVG] [Raster Image]
Genetic_Programming.gv.txt
##"This is an example from a real-world application, where we were using Genetic Programming to do simple symbolic regression. We needed a good way to visualize the trees that were being created, and it didn't take long to code up some lisp to create a dot file that visualized multiple individuals. The next step was to provide color-coding of key nodes so that we could illustrate crossover and mutation of individuals before-and-after-style. This is a sample dot file from some early debugging." Contributed by Wayne Folta.

##Command to get the layout: "dot  -Tpng thisfile > thisfile.png"


graph ""
   {
    fontname="Helvetica,Arial,sans-serif"
    node [fontname="Helvetica,Arial,sans-serif"]
    edge [fontname="Helvetica,Arial,sans-serif"]
#   node [fontsize=10,width=".2", height=".2", margin=0];
#   graph[fontsize=8];
   label="((+ (* (X) (- (- (X) (X)) (X))) (% (+ (X) (X)) (COS (- (X) (X))))) (EXP (* (X) (X))) (+ (% (EXP (SIN (+ (X) (X)))) (SIN (* (X) (EXP (* (X) (X)))))) (* (X) (X))) (% (EXP (% (X) (% (X) (X)))) (EXP (SIN (X)))))"

   subgraph cluster01
   {
   label="(+ (* (X) (- (- (X) (X)) (X))) (% (+ (X) (X)) (COS (- (X) (X)))))"
   n002 ;
   n002 [label="+"] ;
   n002 -- n003 ;
   n003 [label="*"] ;
   n003 -- n004 ;
   n004 [label="X"] ;
   n003 -- n005 ;
   n005 [label="-"] ;
   n005 -- n006 ;
   n006 [label="-"] ;
   n006 -- n007 ;
   n007 [label="X"] ;
   n006 -- n008 ;
   n008 [label="X"] ;
   n005 -- n009 ;
   n009 [label="X"] ;
   n002 -- n010 ;
   n010 [label="%"] ;
   n010 -- n011 ;
   n011 [label="+"] ;
   n011 -- n012 ;
   n012 [label="X"] ;
   n011 -- n013 ;
   n013 [label="X"] ;
   n010 -- n014 ;
   n014 [label="COS"] ;
   n014 -- n015 ;
   n015 [label="-"] ;
   n015 -- n016 ;
   n016 [label="X"] ;
   n015 -- n017 ;
   n017 [label="X"] ;
   }

   subgraph cluster17
   {
   label="(EXP (* (X) (X)))"
   n018 ;
   n018 [label="EXP"] ;
   n018 -- n019 ;
   n019 [label="*"] ;
   n019 -- n020 ;
   n020 [label="X"] ;
   n019 -- n021 ;
   n021 [label="X"] ;
   }

   subgraph cluster21
   {
   label="(+ (% (EXP (SIN (+ (X) (X)))) (SIN (* (X) (EXP (* (X) (X)))))) (* (X) (X)))"
   n022 ;
   n022 [label="+"] ;
   n022 -- n023 ;
   n023 [label="%"] ;
   n023 -- n024 ;
   n024 [label="EXP"] ;
   n024 -- n025 ;
   n025 [label="SIN"] ;
   n025 -- n026 ;
   n026 [label="+"] ;
   n026 -- n027 ;
   n027 [label="X"] ;
   n026 -- n028 ;
   n028 [label="X"] ;
   n023 -- n029 ;
   n029 [label="SIN"] ;
   n029 -- n030 ;
   n030 [label="*"] ;
   n030 -- n031 ;
   n031 [label="X"] ;
   n030 -- n032 ;
   n032 [label="EXP"] ;
   n032 -- n033 ;
   n033 [label="*"] ;
   n033 -- n034 ;
   n034 [label="X"] ;
   n033 -- n035 ;
   n035 [label="X"] ;
   n022 -- n036 ;
   n036 [label="*"] ;
   n036 -- n037 ;
   n037 [label="X"] ;
   n036 -- n038 ;
   n038 [label="X"] ;
   }

   subgraph cluster38
   {
   label="(% (EXP (% (X) (% (X) (X)))) (EXP (SIN (X))))"
   n039 ;
   n039 [label="%"] ;
   n039 -- n040 ;
   n040 [label="EXP"] ;
   n040 -- n041 ;
   n041 [label="%"] ;
   n041 -- n042 ;
   n042 [label="X"] ;
   n041 -- n043 ;
   n043 [label="%"] ;
   n043 -- n044 ;
   n044 [label="X"] ;
   n043 -- n045 ;
   n045 [label="X"] ;
   n039 -- n046 ;
   n046 [label="EXP"] ;
   n046 -- n047 ;
   n047 [label="SIN"] ;
   n047 -- n048 ;
   n048 [label="X"] ;
   }
}Copyright © 1996-2004 AT&T. All rights reserved.